
INFRASTRUCTURE
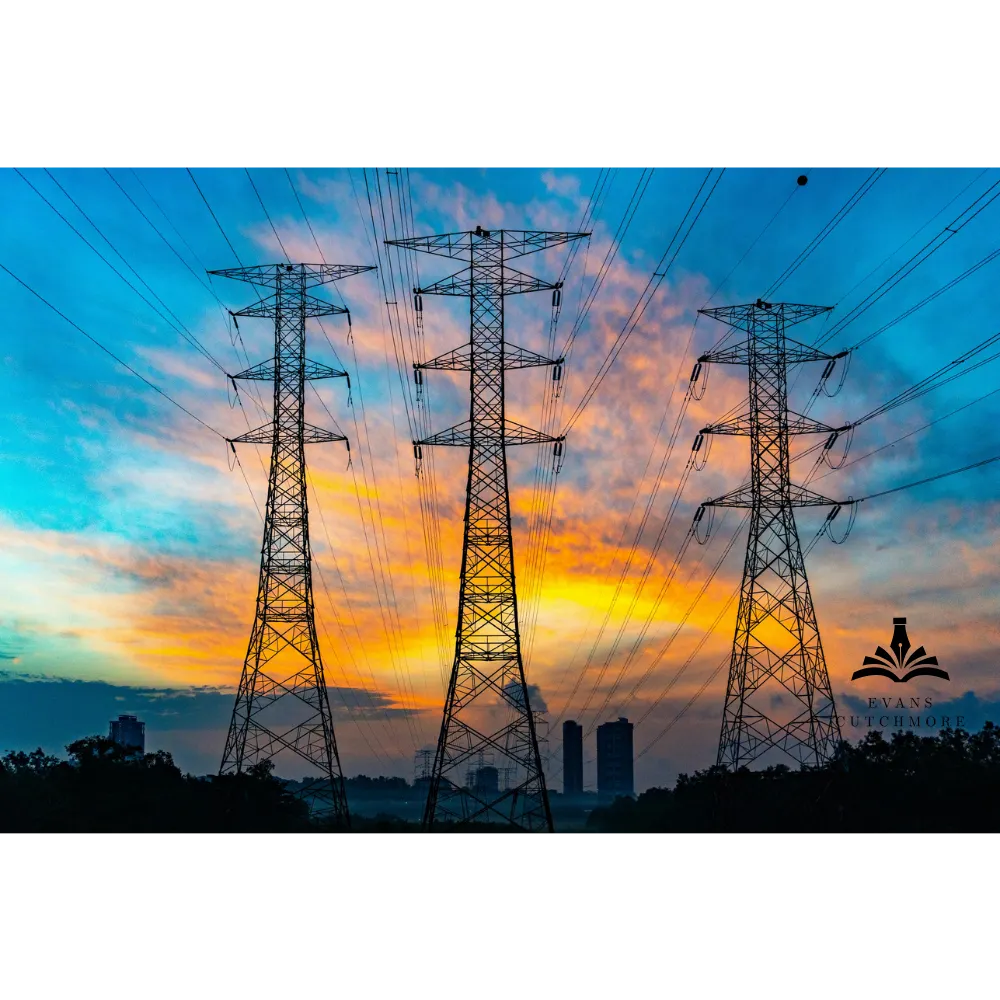
Gary and Puerto Rico are 2,000 miles apart. Their grids fail along the same fault line: poverty.
Kim M. Braud | August 23, 2026
In Gary, Indiana, an open lot behind the Family Life Community Center became a food pantry this month. Residents lined up for shelf-stable groceries because the power had been out for more than a week and their refrigerators were empty. On August 11, a storm carrying 99 mph winds, a speed the National Weather Service compared to a Category 2 hurricane, tore through Northwest Indiana. It knocked out electricity to more than 370,000 customers of the Northern Indiana Public Service Company, better than 60 percent of the utility's service area. Two weeks later, some Gary neighborhoods were still waiting for the lights to come back on.
Roughly 2,000 miles southeast, Puerto Rico spent that same stretch of August with the power mostly on. That is the exception on the island, not the rule. The two places are not experiencing the same event. They are experiencing the same condition, at different speeds.
The acute case
Gary's outage is a discrete catastrophe layered onto an otherwise functional grid. The damage was severe and structural rather than a matter of flipping switches. NIPSCO reported 335 damaged utility poles and 27 substation outages across its territory, with roughly 300 poles and 44 transmission poles needing repair or replacement in Gary alone. Crews were not only restringing wire; in places they were rebuilding electrical systems that no longer existed. Access was its own problem, with equipment stranded behind downed trees, alleys and blocked rights-of-way.
The human cost accumulated as the days stretched on. State officials reported that a 4-year-old boy, three men and three women had died in the region since the storms began. Health researchers flagged the familiar secondary dangers of a long outage: carbon monoxide poisoning from generators run in poor ventilation, medical devices losing charge, and refrigerated food and medication spoiling.
Then came the part that turned frustration into anger. When NIPSCO published estimated restoration times for communities across Northwest Indiana, Gary was initially left off the list entirely. In a majority-Black city where residents already suspected they were an afterthought, the omission read as confirmation. A NIPSCO parent-company executive denied that low-income residents were being deprioritized and attributed the perception to social media posts, noting that affluent areas still had customers without power too. Gary's mayor struck a different tone, telling residents he shared their frustration while progress crawled forward.
The chronic case
Puerto Rico's grid does not need a once-in-a-decade storm to fail. Failure is the baseline. Federal energy data show that even setting aside major events like hurricanes, the average Puerto Rico customer lost about 27 hours of power per year between 2021 and 2024, against roughly 2 hours per year for customers on the mainland. The gap is widening, not closing. In 2025, non-major-event interruptions climbed to about 36 hours per customer, a 19 percent jump over the prior year, in a year with no major hurricane striking the island directly.
The reasons are systemic. The island leans on about 10 aging generators fueled by petroleum, gas or coal that together supply roughly half its capacity, so the loss of a single unit or a fuel shortfall can compromise the whole system. Nine years after Hurricane Maria, analysts documented a 33 percent energy shortfall in 2025, meaning the island's plants could not produce a third of the electricity needed at peak demand. The utility that owns the legacy system, PREPA, carries close to $9 billion in bond debt it cannot pay. Island-wide blackouts have become recurring events rather than emergencies, including a total collapse in April 2025 when every generating plant unexpectedly went dark.
Gary is a functional grid brought down by a storm. Puerto Rico is a grid for which the storm is almost beside the point.
The numbers that rhyme
Strip away the weather and the geography, and the two places converge on a single profile. This is where the comparison stops being a coincidence.
| Measure | Gary, Indiana | Puerto Rico | U.S. benchmark |
|---|---|---|---|
| Poverty rate | 33.1% | 37.3% | ~12.2% |
| Median household income | $38,731 | $27,213 | $81,604 |
| Share of majority-minority population | 76% Black | overwhelmingly Hispanic/Latino | n/a |
| Population trend | ~67,000, down from a mid-century peak near 178,000 | 3.18M, down from 3.8M around 2000 | growing |
| Residential electricity cost | region-average | ~45% above mainland (~23.8 cents/kWh) | ~16.4 cents/kWh |
Both carry poverty rates roughly three times their reference population. Both post median household incomes around half the national figure or lower. Both are majority-minority communities. Both have lost population for a generation, hollowing out the tax base that funds and maintains public infrastructure. And in Puerto Rico's case, the residents who can least afford it pay the highest electricity rates in the U.S. system for the least reliable service, a regressive arrangement that Gary households now taste in compressed form every time an outage forces them to buy generators, ice, restaurant meals and replacement groceries.
The loop
Read together, the two cases describe a self-reinforcing cycle rather than two isolated failures.
Population decline shrinks the revenue that pays for grid maintenance and hardening. Deferred maintenance makes the grid more fragile. A fragile grid fails more often and takes longer to restore. Long, frequent outages impose costs, in spoiled food, lost wages, damaged appliances and closed businesses, that fall hardest on households with no financial cushion. Those costs push more residents and employers out, which shrinks the tax base further. The loop tightens.
Race and poverty are not incidental to this cycle. They shape which communities got underinvested infrastructure in the first place, which ones utilities reach last, and which ones lack the political leverage to demand faster answers. A restoration list that leaves off a majority-Black city, whether by oversight or by triage, lands on top of a century of that pattern. The data do not require anyone to assign motive. They simply show where the burden settles.
Sidebar
Ask how many data centers sit inside the city of Gary and the answer is small: roughly one early-stage project, with no formal proposal before the Common Council as of March 2026. But that question uses the wrong boundary. A storm downs the same poles no matter who draws power, so location does not explain this outage. And the part of the story that does matter to residents, the cost, does not stop at the city line either.
The unit that matters is the utility. Nearly every data center project in Northwest Indiana sits inside NIPSCO's service territory, the same regulated monopoly that serves Gary and that just left parts of the city dark for two weeks. Lake and Porter counties are core NIPSCO ground, and the territory reaches into LaPorte. That means all of this new demand feeds one load-growth forecast, one dedicated-generation buildout through NIPSCO's GenCo subsidiary, and one cost-allocation fight, and Gary ratepayers are inside it. A public Indiana project tracker lists roughly 16 data center projects across about 10 communities ringing Gary, all within NIPSCO territory:
| Community | Projects |
|---|---|
| Merrillville | 3 |
| Hobart | 2 |
| Hammond | 2 |
| Portage | 2 |
| Wheeler | 2 |
| Chesterton | 1 |
| Burns Harbor | 1 |
| Valparaiso | 1 |
| Michigan City | 1 |
| Gary | 1 |
| Total | ~16 |
Two things this table is not. It is not a building count: a single project or campus can be one hall or a dozen structures. And it is not a megawatt count: the honest measure of grid strain is forecasted new demand on NIPSCO, not dots on a map. NIPSCO's peak load, around 2,300 megawatts today, could quadruple over the next decade, and the company has said the overwhelming majority of that inquiry is data centers.
Nor is it a count of what is built. Much of the cluster is proposed, not operating. Indiana's House Bill 1007 requires a proposed data center to commit to covering 80 percent of the cost of new generation even if the project never gets built, a provision meant to shield ratepayers. Critics, including the Citizens Action Coalition, argue the protections are priced too low: they contend residential bills for 1,000 kilowatt-hours already rose about $83 a month between 2023 and 2025, and that the credits NIPSCO promises existing customers fall short of what large users would owe at standard industrial transmission rates.
The takeaway is not proximity. It is that the same utility, and the same ratepayers, carry both the new demand and the aging distribution network that failed. The neighborhoods that waited two weeks for the lights are the ones being asked to help underwrite a grid built to serve everyone but them first.
Where the parallel breaks
Honesty about the differences is what makes the comparison usable rather than rhetorical.
Gary is a poor city inside a solvent state and a national grid; its crisis is acute and, however slowly, ends. Puerto Rico is a territory with a distinct and unresolved political status, a bankrupt utility, a privatized transmission operator in LUMA Energy, and federal energy orders directing its recovery. Its crisis is chronic and structural, with no restoration date because there is no single event to restore from. The socioeconomic numbers rhyme almost exactly. The political and financial mechanics do not. Treating the two as identical would flatten the very differences a reader needs in order to understand either one.
Why it matters here
None of this is confined to Indiana or the Caribbean. The pattern, that the communities least able to absorb a loss of power are the ones who lose it most often and for the longest, has clear analogues along the Gulf Coast and in Louisiana's own low-income and majority-Black communities, where storm exposure, aging infrastructure and thin municipal budgets meet. Gary and Puerto Rico are useful precisely because they sit at opposite ends of the same spectrum: the sudden failure and the permanent one. Between those poles is where most American energy poverty actually lives.
The question worth carrying forward is not whether a given outage was anyone's fault. It is why the map of who stays in the dark keeps tracing the map of who was already struggling, and what it would take to break the loop instead of documenting another turn of it.
How to follow this
We are tracking grid reliability and restoration equity as an ongoing thread, with an eye toward the Louisiana parallels. If you work in utility operations, emergency management or community organizing, or if your household has lived through a prolonged outage and want to share what it cost you, reach out through the newsroom. Documentation, restoration-time records and utility correspondence are all useful. We will keep publishing the numbers as they come in.
Kim M. Braud is the Founder & Editor of Evans Cutchmore Press, an independent newsroom covering Louisiana and the Gulf South. Her reporting focuses on government accountability, infrastructure, business, culture, and the public policies that shape communities.
© 2026 Evans Cutchmore Press. All rights reserved.